What is MSY?
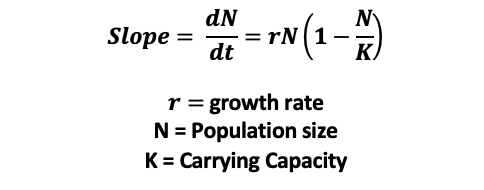
MSY can be defined as the maximum catch that you can continuously take from a population usually used by fisheries to manage fish populations sustainably. The Maximum Sustainable Yield can be calculated by deriving the slope of the logistic curve, setting it equal to zero and rearranging for N.
Credits: University, Purdue. “Logistic Models – Rhea.” www.projectrhea.org, n.d. https://www.projectrhea.org/rhea/index.php/Logistic_Models.
Schaefer modelled MSY using a “S shaped” logistic curve that depicts time on the horizontal axis and biomass on the vertical axis. The shape of the curve depicts growth in biomass as time increases, with a levelling as growth approaches a fixed-point K (carrying capacity). The most widely used depiction of the logistic curve is by Ricker (1975).
A History of MSY : Post WWII
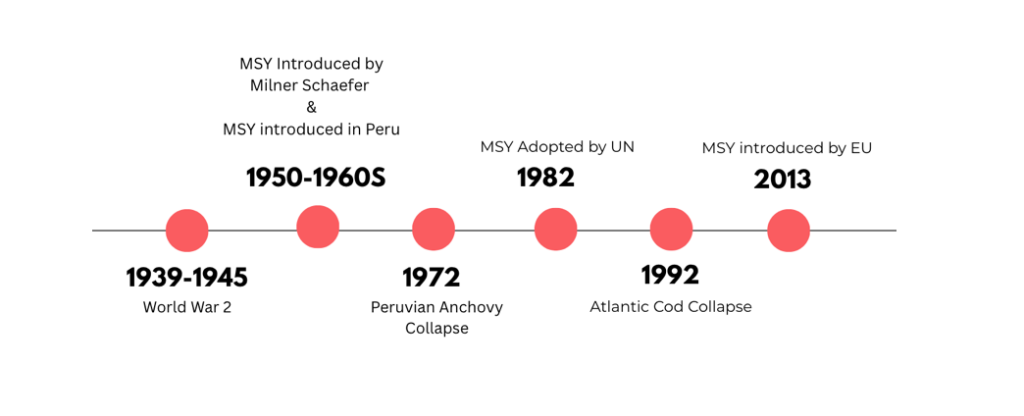
Origins: The concepts behind MSY introduced elements already discussed by prominent figures in fishery science such as Baranov, Russel and Graham. These ideas began to be more formally introduced by Schaefer, Ricker using the concept of “Maximum Sustainable Yield” which was then further expanded on by Beverton and Holt in later works after WWII as discussed by Larkin in his article about MSY. World War II contributed not only to the advancement of the fishery industry but also new policies that incorporated mathematical models such as MSY to predict catch data.
Technological Advancements: During the war there was an increased demand by the Navy for better technologies and advancements compared to other countries which helped develop fishing technology including inventions such as locational devices and sonar technologies. This led to better fishing efficiency and survival rates for marine populations.
Regulatory policies:
New regulatory policies after the war also came into play to control limits on fishing for countries in an attempt to conserve fish populations such as the Truman Proclamation (1945), compared to previously where the sea was seen as free for all. Many of these new policies created in the post-war period used oversimplified models such as MSY to manage their fish populations, leading to severe consequences and fishery collapses such as the Peru Cod Collapse.
MSY was starting to be adopted by the US in 1948 in fishery regulations and formed the basis of many international fisheries treaties including a treaty in 1949 with Mexico and Costa Rica. Japan was also pressured to adopt MSY in the management of their salmon stocks in 1951. MSY as a policy was criticised by many prominent figures in fishery science of the time such as Larkin, Michael Graham, D.B. Finn, Sidney Holt and biologist Tim B. Smith but stills forms the basis of many policies today.
Limitations of MSY
An article by “SeaAroundUs” that interviews marine scientists Daniel Pauly and Rainer Froese discusses some of the issues with the concept of MSY and how it is used by fisheries to manage fish populations. Stockholm University Baltic Sea Centre also discusses the factors impacting MSY calculations:
- Assuming a lower MSY point: The model has been abused by some fishery agencies who have been modifying the original Schaefer model by assuming MSY occurs at a lower stock population size than the original MSY point of 50%, leading to overfishing.
- Incorporating multiple populations: Another failure occurs when MSY is applied to multiple populations. This fails as the decline of size of one species of fish does not necessarily impact another species/population of fish.
- Unreliable data: There can be issues with data itself, if the data is unreliable, this can lead to an unreliable estimate for MSY. Additionally, it is also not always easy to calculate rate of growth of fish populations, and some official assessments fail to account for data from earlier catches as discussed by Pauly.
- Natural fluctuations: It is also difficult to account for natural fluctuations in stock populations and the effect of environmental variation such as temperature fluctuations.
Peruvian Anchovies Collapse (1972-1973)
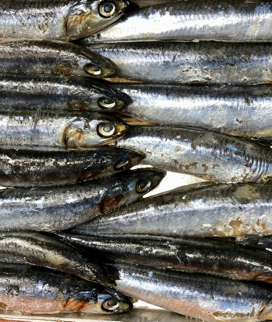
Milner Schaefer was an American biologist, who in the 1960’s worked alongside the Peruvian fisheries Government and the FAO to create a maximum catch limit for the Peruvian fisheries. He approximated this value to be around 10 million tons per year. Despite the aim of this limit to maintain the anchovy populations, the fish populations declined rapidly as a result of the El Niño effect that took place in 1972. This resulted in a fishery collapse as the MSY model failed to account for this changing of environmental conditions, as the El Niño caused the temperature in Peru to warm up from 22 to 30.3 degrees.
An article by Jyl Hoyt discusses the effect of the collapse including loss of up to 50,000 jobs in Peru. The article also discusses the difficulties of accounting for El Nino due to changing climate conditions and accounting for bycatches and illegal catches contributing to the overfishing of the anchovies outside of the set limits.
Atlantic Cod Collapse (1992)
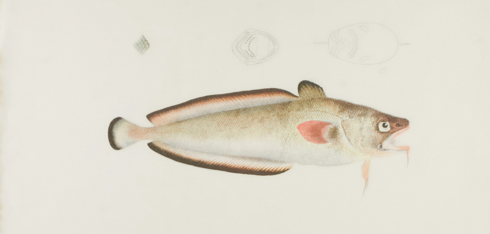
The Atlantic Cod collapse in 1992, though primarily can be explained by overfishing and the concept of ‘Tragedy of the Commons’ in economics. The Atlantic cod collapse, though not directly using MSY, used a similar concept to MSY known as Total Allowable Catch (TAC) which contributed to the cod fishery populations being overfished.
Overfishing: The primary cause was overfishing. The cod populations in the Atlantic were seen as inexhaustible and as a result of new post-war technologies, catch efforts doubled. The result was that the cod were overfished, and the population fell by 93%. As a result, employment in the region fell with a loss of up to 30,000 jobs.
Total Allowable Catch (TAC): An article by the ‘Electronic Green Journal’ discusses how the models used to estimate catch values set the limits too high. Government pressure influenced scientists to set their catch limits higher than the estimated level, even when scientists were aware of errors in the initial TACs. The errors in catch estimates also were because of inaccurate mortality predictions and unreliable data on catch rates. The article also discusses possible external factors such as decrease in temperature or predation that may have impacted cod populations.
Bibliography
Anon (2021). The Fisheries Secretariat. [online] www.fishsec.org. Available at: https://www.fishsec.org/management-strategies/msy-objective/.
Fao.org. (2019). Review of the state of world marine fishery resources. [online] Available at: https://www.fao.org/4/y5852e/Y5852E07.htm.
Fath, B. (2019). Encyclopedia of ecology. Amsterdam Elsevier.
Ferguson-Cradler, G. (2018). Fisheries’ collapse and the making of a global event, 1950s–1970s. Journal of Global History, 13(3), pp.399–424. doi:https://doi.org/10.1017/s1740022818000219.
Finley, C. and Oreskes, N. (2013). Maximum sustained yield: a policy disguised as science. ICES Journal of Marine Science, 70(2), pp.245–250. doi:https://doi.org/10.1093/icesjms/fss192.
Helentjaris, D. (2019). small fish. [online] Unsplash.com. Available at: https://unsplash.com/photos/small-fish-8RSULPhHRy4 [Accessed 1 May 2025].
Holm, P. (2012). World War II and the ‘Great Acceleration’ of North Atlantic Fisheries. Global Environment, [online] 5(10), pp.66–91. doi:https://doi.org/10.3197/ge.2012.051005.
Hoyt, J. (2003). Peru Fishery Collapse? [online] Living on Earth. Available at: https://loe.org/shows/segments.html?programID=96-P13-00008&segmentID=7.
Idyll, C.P. (1973). The Anchovy Crisis. Scientific American, 228(6), pp.22–29. doi:https://doi.org/10.1038/scientificamerican0673-22.
Jennings, S., Kaiser, M.J. and Reynolds, J.D. (2009). Marine fisheries ecology. Oxford ; Malden, Ma, Usa: Blackwell Science.
Larkin, P.A. (1977). An Epitaph for the Concept of Maximum Sustained Yield. Transactions of the American Fisheries Society, 106(1), pp.1–11. doi:https://doi.org/10.1577/1548-8659(1977)106%3C1:aeftco%3E2.0.co;2.
Los Huertos, M. (2020). The Rules: Population Growth and Competition. Ecology and Management of Inland Waters, (ISBN 9780128142660), pp.131–150. doi:https://doi.org/10.1016/b978-0-12-814266-0.00017-9.
Luart Aimme, D. (2022). Wildlife & Welfare. [online] Wildlife & Welfare. Available at: https://www.wildlifeandwelfare.org/news-blog/the-illegal-wildlife-trade-the-greatest-direct-threat-to-species-jx2kx.
Mason, F. (2002). The Newfoundland Cod Stock Collapse: A Review and Analysis of Social Factors. Electronic Green Journal, [online] 1(17). doi:https://doi.org/10.5070/G311710480.
Pauly , D. and Froese, R. (2021). Fisheries managers should not abuse Maximum Sustainable Yield – Sea Around Us. [online] SeaAroundUs. Available at: https://www.seaaroundus.org/fisheries-managers-should-not-abuse-maximum-sustainable-yield/.
Rosen, J.-L. (2019). Fact sheet: Understanding MSY – Stockholm University Baltic Sea Centre. [online] Www.su.se. Available at: https://www.su.se/stockholm-university-baltic-sea-centre/web-magazine-baltic-eye/fisheries/fact-sheet-understanding-msy-1.607831?cache=%2Fcareers [Accessed 1 May 2025].
Seal, B. (2024). A Tragedy with No End. [online] Science History Institute. Available at: https://www.sciencehistory.org/stories/magazine/a-tragedy-with-no-end/.
University, P. (n.d.). Logistic Models – Rhea. [online] www.projectrhea.org. Available at: https://www.projectrhea.org/rhea/index.php/Logistic_Models.
Victoria, M. (2024). Photo by Museums Victoria on Unsplash. [online] Unsplash.com. Available at: https://unsplash.com/photos/nYgXtQF66fc [Accessed 1 May 2025].
*All photos are copyright free, sourced from unsplash.com under the unsplash license