Florence Nightingale and the Polar Area Diagram
Throughout history, women have faced many challenges and barriers, yet they have made substantial progress in the study of mathematics. Even so, their successes have frequently been overshadowed by those of their male colleagues. The desire to highlight the significant contributions made by women to mathematics has grown in recent years. As a result, researchers have begun to acknowledge and appreciate the significant impact that women, such as Florence Nightingale, have had in this field.
Florence Nightingale and the Polar Area Diagram
Florence Nightingale is well known for her groundbreaking use of data graphics during the Crimean War (1853-1856). She is credited with originating the Polar Area Diagram (also known as the Rose Diagram), a graphic representation of statistical information.
Nightingale was horrified by the dire conditions at Scutari military hospital during the Crimean War, where medical supplies were scarce, hygiene was ignored, and preventable diseases were rampant, resulting in higher mortality rates for British soldiers.
She meticulously recorded the soldiers’ causes of death and analyzed the data using statistical techniques, revealing that poor sanitation and preventable diseases were the primary causes of death rather than injuries sustained in battle.
Nightingale used her findings to advocate for public health reforms and presented a circular diagram with segments representing deaths per month, two circular graphs resembling clocks depicting the initial and final 12 months of the war, and blue, red, and black sections indicating deaths caused by infectious diseases, wounds, and other causes, respectively.
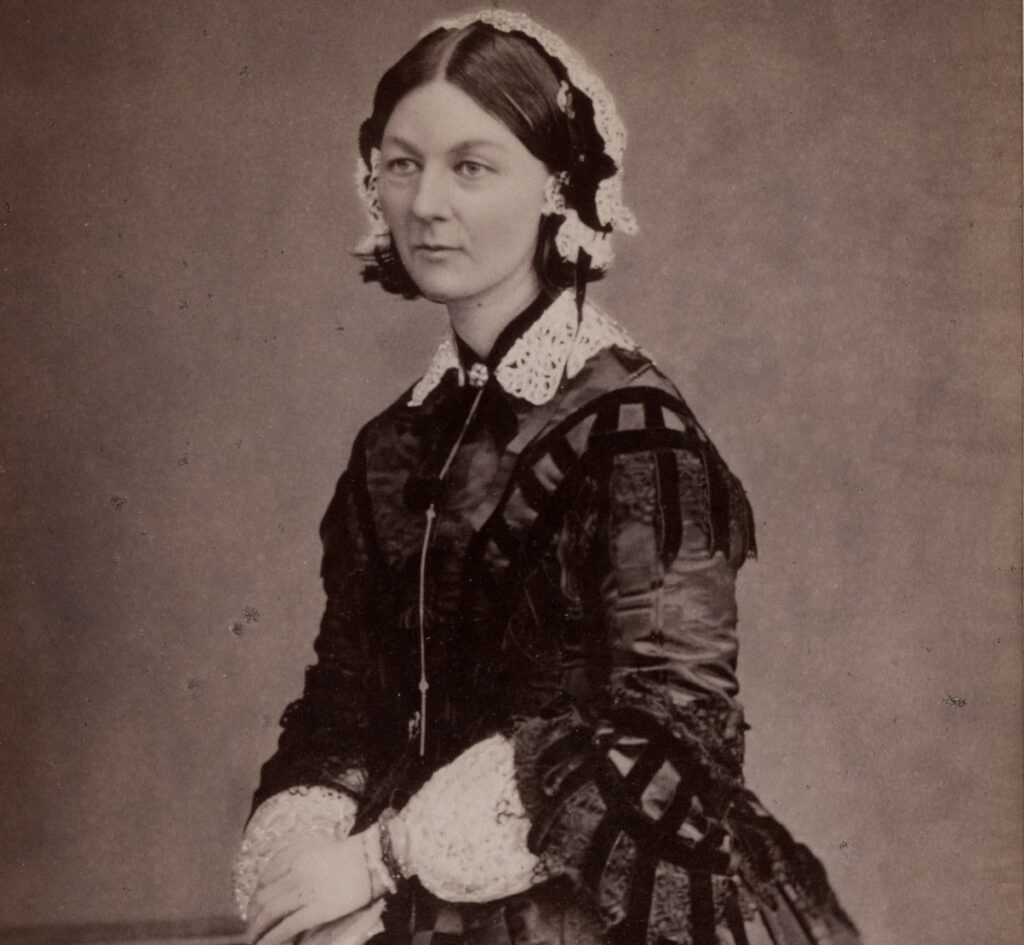
Image credit: Bibliothèque interuniversitaire de santé, Open Licence 1.0 via Wikimedia Commons.
Through the diagram displayed below right, Nightingale demonstrated the correlation between the implementation of sanitation measures by the British Government’s Sanitary Commission in 1855 and the decrease in fatalities caused by contagious diseases, highlighting the immediate and significant impact of the change in medical policy on the death rate from infectious diseases.
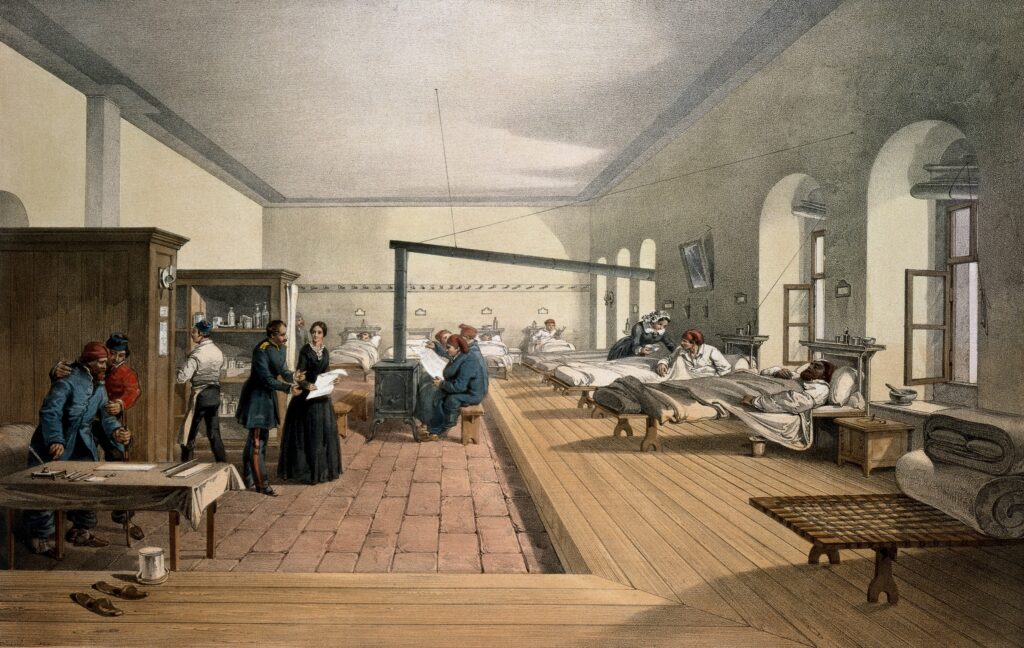
Image credit: public domain via Welcome Collection.
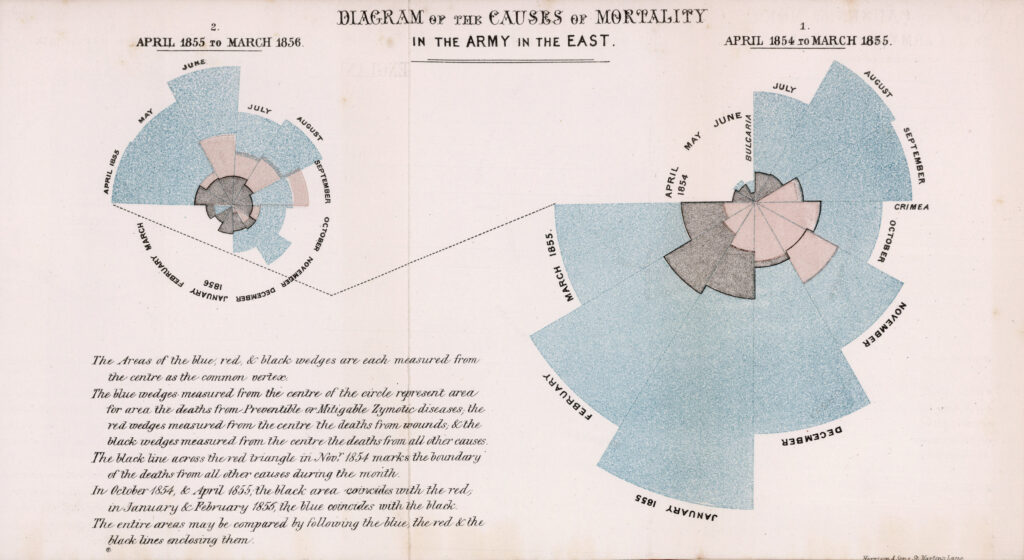
Image credit: public domain via Wikimedia Commons.
Importance of Nightingale’s Work
In numerous ways, Nightingale’s work was revolutionary. Firstly, she was one of the pioneers in using statistical analysis to examine public health and emphasized that data visualization is necessary to present complicated data to the public (Arnstein, 1956). Additionally, Nightingale’s work challenged the societal norms of gender, showing that women could make notable contributions in the field of mathematics and statistics.
Furthermore, Nightingale’s Polar Area Diagram remains a valuable asset in data visualization. Currently, data visualization is a crucial component of modern data science, and the Polar Area Diagram is an early illustration of how visualizing data can make it more accessible and easier to comprehend.
The Florence Nightingale Museum at St Thomas’ Hospital in London is dedicated to the life and work of Florence Nightingale. The museum showcases her contributions to nursing and public health, as well as her groundbreaking work in mathematics and statistics. Visitors can explore Nightingale’s life through a variety of exhibits, including her personal belongings, nursing tools, and statistical diagrams.
The significance of Florence Nightingale’s impact in the areas of mathematics and statistics, as well as her involvement in public health, demonstrates the vital role that women have played and still play in the realm of mathematics. Her Polar Area Diagram is still valued as a crucial addition to the field of data representation, and her influence continues to motivate and impact modern mathematicians and data analysts. It is crucial to acknowledge and applaud the achievements of women in mathematics and to encourage future generations of females to pursue careers in Science, Technology, Engineering and Mathematics (STEM) fields.
Author
Arina Bekenova